Preskoči na glavno vsebino

Kako med pregledovanjem v Excelu vedno obdržati grafikon?

Avtor: Sonce Zadnja sprememba: 2020-07-22

Če je v listu vstavljen grafikon, medtem ko med pomikanjem lista navzdol prikazujete podatke, grafikona ni mogoče videti hkrati, kot je prikazano na spodnji sliki zaslona, ​​kar mora biti grdo. V tem članku predstavljam kodo VBA, da je grafikon vedno na vidnem mestu, čeprav se list pomikate navzdol ali navzgor.

doc vodi grafikon v pogledu 1
doc puščica navzdol
doc vodi grafikon v pogledu 2

Vedno imejte grafikon na vidnem mestu


puščica modri desni mehurček Vedno imejte grafikon na vidnem mestu

Če želite obdržati grafikon med pomikanjem po listu, lahko za njegovo rešitev uporabite spodnjo kodo VBA

1. Z desno miškino tipko kliknite zavihek lista, za katerega želite, da je grafikon viden, in kliknite Ogled kode iz kontekstnega menija. Oglejte si posnetek zaslona:
doc vodi grafikon v pogledu 3

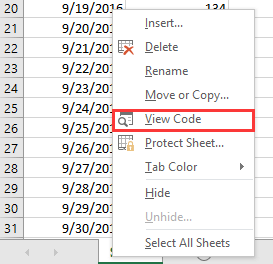
2. V popping Microsoft Visual Basic za aplikacije okno, prilepite spodnjo kodo v prazen skript.

VBA: Grafikon naj bo vedno v ogledu

Private Sub Worksheet_SelectionChange(ByVal Target As Range)
'UpdatebyExtendoffice20161111
    Dim CPos As Double
    Application.ScreenUpdating = False
    CPos = ActiveWindow.ScrollRow * ActiveCell.RowHeight
    ActiveSheet.ChartObjects("Chart 2").Activate
    ActiveSheet.Shapes("Chart 2").Top = CPos
    ActiveWindow.Visible = False
    Application.ScreenUpdating = True
End Sub

doc vodi grafikon v pogledu 5

3. Shranite in zaprite pogovorno okno, nato pa se grafikon premakne navzdol ali navzgor, ko kliknete katero koli celico.
doc vodi grafikon v pogledu 6

Opombe:

(1) V kodi VBA je grafikon 2 ime grafikona, ki ga želite imeti na ogled, lahko ga spremenite po potrebi.

(2) Ta VBA ne more vedno imeti na ogled skupine grafikonov.

Najboljša pisarniška orodja za produktivnost

🤖 Kutools AI Aide: Revolucionirajte analizo podatkov na podlagi: Inteligentna izvedba   |  Ustvari kodo  |  Ustvarite formule po meri  |  Analizirajte podatke in ustvarite grafikone  |  Prikličite funkcije Kutools...
Priljubljene funkcije: Poiščite, označite ali identificirajte dvojnike   |  Izbriši prazne vrstice   |  Združite stolpce ali celice brez izgube podatkov   |   Krog brez formule ...
Super iskanje: Več kriterijev VLookup    Multiple Value VLookup  |   VLookup na več listih   |   Nejasno iskanje ....
Napredni spustni seznam: Hitro ustvarite spustni seznam   |  Odvisni spustni seznam   |  Večkrat izberite spustni seznam ....
Upravitelj stolpcev: Dodajte določeno število stolpcev  |  Premakni stolpce  |  Preklop stanja vidnosti skritih stolpcev  |  Primerjaj obsege in stolpce ...
Predstavljene funkcije: Mrežni fokus   |  Pogled oblikovanja   |   Velika vrstica formule    Upravitelj delovnih zvezkov in listov   |  Knjižnica virov (Samodejno besedilo)   |  Izbirnik datuma   |  Združite delovne liste   |  Šifriranje/dešifriranje celic    Pošljite e-pošto po seznamu   |  Super filter   |   Poseben filter (filter krepko/ležeče/prečrtano ...) ...
15 najboljših kompletov orodij12 Besedilo Orodja (dodajanje besedila, Odstrani znake,...)   |   50 + Graf Vrste (Gantt Chart,...)   |   40+ Praktično Formule (Izračunajte starost glede na rojstni dan,...)   |   19 vstavljanje Orodja (Vstavite kodo QR, Vstavi sliko s poti,...)   |   12 Pretvorba Orodja (Številke v besede, Pretvorba valut,...)   |   7 Spoji in razdeli Orodja (Napredne kombinirane vrstice, Razdeljene celice,...)   |   ... in več

Napolnite svoje Excelove spretnosti s Kutools za Excel in izkusite učinkovitost kot še nikoli prej. Kutools za Excel ponuja več kot 300 naprednih funkcij za povečanje produktivnosti in prihranek časa.  Kliknite tukaj, če želite pridobiti funkcijo, ki jo najbolj potrebujete...

Opis


Kartica Office prinaša vmesnik z zavihki v Office in poenostavi vaše delo

  • Omogočite urejanje in branje z zavihki v Wordu, Excelu, PowerPointu, Publisher, Access, Visio in Project.
  • Odprite in ustvarite več dokumentov v novih zavihkih istega okna in ne v novih oknih.
  • Poveča vašo produktivnost za 50%in vsak dan zmanjša na stotine klikov miške za vas!
Comments (15)
Rated 4.75 out of 5 · 2 ratings
This comment was minimized by the moderator on the site
A mí me pasa que la siguiente vez que abro el archivo, el script ya no funciona. Tengo que copiarlo, borrarlo, cerrar el archivo tras guardarlo, volver a abrir el archivo y volver a pegar el script en VBA. ¿Alguna solución?
Rated 4.5 out of 5
This comment was minimized by the moderator on the site
Hi, save the workbook as excel macro enable workbook, the vba will be work when open next time.https://cdn.extendoffice.com/images/stories/comments/sun-comment/doc-macro-enable.png
This comment was minimized by the moderator on the site
I encountered a problem with unselecting the cell and needed two charts, So I made some changes and it seems to work now.
To use it put the right Chart Name.
*Note: This one is for two charts


Private Sub worksheet_selectionchange(ByVal target As Range)
Dim chartposition As Double

chartposition = ActiveWindow.ScrollRow * ActiveCell.RowHeight
ActiveSheet.Shapes("Chart 2").Top = chartposition

ActiveSheet.ChartObjects("Chart 3").Top = chartposition + 250

End Sub
This comment was minimized by the moderator on the site
Can any one assist. when i follow theses steps


Private Sub Worksheet_SelectionChange(ByVal Target As Range)
'UpdatebyExtendoffice20161111
Dim CPos As Double
Application.ScreenUpdating = False
CPos = ActiveWindow.ScrollRow * ActiveCell.RowHeight
ActiveSheet.ChartObjects("Chart 2").Activate
ActiveSheet.Shapes("Chart 2").Top = CPos
ActiveWindow.Visible = False
Application.ScreenUpdating = True
End Sub


i get the following err

Run-Time error '-2147024809 (80070057)':
The item with the specified name was not found

when i debug
ActiveSheet.ChartObjects("Chart 2").Activate
This comment was minimized by the moderator on the site
Hi, Christo, you need to change the chart name "Chart 2" to your chart really name in the script. You can click at the chart and see its name in the name box. See screenshot:
https://www.extendoffice.com/images/stories/comments/sun-comment/do_chart_name.png
This comment was minimized by the moderator on the site
yes thanks. after a made the question i realised my chart name was wrong
thanks

ps.
do you perhaps know how i can make the chart kept in view as i scroll without clicking where it must follow
This comment was minimized by the moderator on the site
can I use Kutools to automatically use that VBA for my charts??
This comment was minimized by the moderator on the site
Sorry, Wangnuli, Kutools has not support this so far.
This comment was minimized by the moderator on the site
Hola muchas gracias por el código, utilizando este código ¿Hay alguna manera de limitar qué tan alto en la hoja se reubicará el gráfico? por ejemplo, no quiero que se coloque encima de la fila 9. Ayuda por favor.
Rated 5 out of 5
This comment was minimized by the moderator on the site
Is there a way to limit how high up on the sheet the chart will relocate to? I don't want it to affix above row 8
This comment was minimized by the moderator on the site
Is there a similar formula that can be built for Google Sheets?
This comment was minimized by the moderator on the site
This macro did exactly what I wanted. However it created another problem that I wondered if you might have a solution to.

While this macro is active I cannot select cells for other purposes such as formatting or merging them. Click and drag, shift nor ctrl work to select a group of cells. I can only select the one cell I clicked on. I frequently want to change formatting (background, fill down a formula, etc.) The only way I have been able to do this is to delete the macro, save, make my formatting changes, paste the macro back in and save.

Is there a simpler way to do this? Perhaps:

1. (preferred) A simple keystroke that would temporarily disable the macro and then re-enable it.

2. Some code added to the macro to allow selection of a group of cells.

Dennis
This comment was minimized by the moderator on the site
This was good but I wish there was a way that it would just move with the scroll wheel, like heading lines. Also if I want to select a cell it takes two clicks. The first click moves the chart but also selects the chart so I have to click again to select the cell.
This comment was minimized by the moderator on the site
I added "activecell.select" on the last line of this code and it fixed the double clicking issue. It will automatically select the last active cell, which will be the one you clicked on to move the chart. Hope this helps.
This comment was minimized by the moderator on the site
THIS IS WHAT I NEEDED! GOLDEN!
There are no comments posted here yet
Please leave your comments in English
Posting as Guest
×
Rate this post:
0   Characters
Suggested Locations